(I don’t think this is my final analysis of the company, I will keep updating and adding more analysis)
Whitehaven Coal is a coal mining and exploration company listed in ASX. The price on Friday, Aug.13th 2021 ended at 2.38 and on Thursday of Sept. 30th, 2020 ended at 3.23. About 36% up in just one month and a half. The share of outstanding is 1.03B so that market capitalization is A$3.33B. The company sells high-quality coal products to the Asian market mainly Japan (55%), Taiwan (16%), Korea (15%) for thermal coal, India (48%), Japan (16%), Vietnam (12%), and Korea (11%) in FY20. The company’s share price soars because the coal price is now the highest at least the last 10 years. I am not sure the coal price keeps at this level. The demand for coal surged after the COVID-19 restriction started lifting around the world. Also, there are Chinese demands although the Whitehaven is not selling their coal directly to China. I wrote here until when I hold this company of shares.
| FY20-1 (million) | FY20-2 (million) | FY21-1 (million) | FY21-2 (million) | |
| Revenue | 885.1 | 836.5 | 699.3 | 857.7 |
| EBITDA | 177.3 | 128.7 | 37.2 | 167.3 |
| NPAT | 27.4 | 2.6 | -94.5 | -449.4 |
| Dividend | 1.5 | 0 | 0 | 0 |
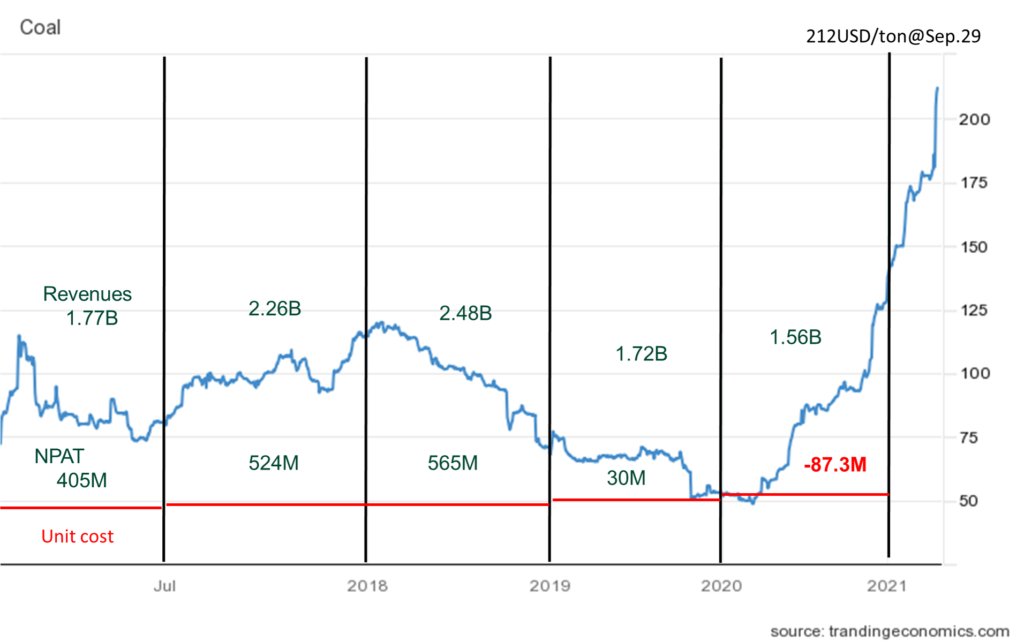
The company was having a hard time last the 4 half-year results because of the coal price. After the coal price came back, the price of the share has been rising. I believe the company will start making money in FY22-1 because of the high coal price. I could not see a big picture here so I checked at least 5 years of history as below.
| \A$m | FY17 | FY18 | FY19 | FY20 | FY21 |
| Revenue | 1,773.2 | 2,257.4 | 2,487.9 | 1,721.6 | 1557.0 |
| EBITDA(underlying)(*) | 714.2 | 1011.9 | 1041.7 | 306 | 204.5 |
| Net profit after tax | 405.4 | 524.5 | 564.9 | 30 | -543.9 |
| EPS (taken from WSJ) | 0.41 | 0.53 | 0.53 | 0.03 | -0.55 |
| Operating Cashflow (**) | 607.6 | 883.4 | 916.5 | 146.4 | 138.8 |
| Net debt | 311.1 | 270.4 | 161.5 | 787.5 | 808.5 |
| Dividend (cents) | 6 | 40 | 50 | 1.5 | 0 |
Surprisingly, on the day of releasing FY21 results, the share price rose 4.95%. I believe the investor understood this NPAT is the worst last 5 years because of the A$650m impairment of their asset. Revenue went down last two financial years it is because the coal price was low. I will show you later but the coal production does not change much last 5 years. In the last 5 years, FY18 and FY19 they had good NPAT but now the coal price is much higher since the beginning of FY22.
(*)I tried to find information from the company’s financial report but I saw some inconsistency. (**)I took data from the company’s financial report and the WSJ website.
| \A$m | FY17 | FY18 | FY19 | FY20 | FY21 |
| Unit cost/ton $Am | 58 | 58(62)(***) | 67 | 75 | 74 |
| Realized thermal coal Prices USD/t | 81 | 98 | 100 | 66 | 68 |
| Matellgurical USD/t | 102 | 119 | 119 | 89 | 85 |
| ROM coal production Mt | 23.1 | 23.0 | 23.2 | 20.7 | 20.7 |
| Sales Mt | 20.7 | 22.1 | 21.6 | 20.2 | 19.8 |
| Thearmal coal (Mt) | 16.2 | 16.1 | 17.5 | 17.2 | 17.2 |
| Metallurgical coal (Mt) | 4.4 | 6.0(****) | 4.1 | 3.0 | 2.6 |
| 0.75 | 0.78 | 0.72 | 0.67 | 0.74 |
I have tried to calculate some here. The coal run-of-mine (ROM) production FY21 was 20.7Mt, Managed coal sales were 19.8Mt. The company sells coal about 20Mt each year. The production and sales look stable for at least 5 years even with COVID-19 and bushfires, and floods. So, the average sales of coal are about 20Mt/year = 55kt/day. The gross profit a day would be 55kt*(212USD/0.719-74)= A$12.1 million a day. They are getting 12.1 m/1.03 b = $0.0117 per share a day. If I assume 55kt*(120USD/0.719-74)= A$5.11 million a day. They are getting 5.13 m/1.03 b = $0.005 per share a day. The net debt is 808.5m at the end of FY21, 67 days just needed to pay them all with the current 212USD/ton level.
FY20 sales = 17.2Mt*(66/0.67)+3.0Mt*(89/0.67)=1694m+398m=2092m
FY21 sales = 17.2Mt*(68/0.74)+2.6 Mt*(85/0.74)=1580m+298m=1878m
Somehow, I am off for about 371m and 321m from Revenues, why? I need to revise here again.
FY21 profit = 17.2Mt*(68/0.74-74)+2.6Mt*(85/0.74-74)=308m+106m=412m, this is also different from EBITDA or NPAT. Maybe I need to understand the account better. I will update these later.
(***) I see the inconsistency of the cost of coal/ton or unit cost/ton (****) I might have missed but I could not find the number in financial reports from WHC.
